Using Weather Station Data on Connecticut School Grounds and Athletic Fields
By Vickie Wallace and Alyssa Siegel-Miles UConn ExtensionThe ability to scout to prevent pest problems before they occur, and to correct problematic management practices as early as possible, helps athletic field and grounds managers better manage their athletic fields and facility properties. Weather stations are a powerful tool that have long been utilized in production agriculture, and have been accepted as essential equipment in golf courses and other professional turfgrass settings. Weather stations can support Connecticut school grounds and athletic field managers in their efforts to make timely and skilled pest management decisions. The use of weather stations can be adapted and incorporated into school grounds maintenance programs.
WHAT ARE WEATHER STATIONS?
A weather station is a group of centrally organized instruments that measure atmospheric and soil conditions using many different sensors. On-site weather stations monitor the microclimate of a specific growing area, including:
-
- Soil temperature & moisture
- Precipitation
- Relative humidity
- Leaf wetness
- Solar radiation
- Evapotranspiration (ET)
- Dew point temperature
- Air temperature
- Soil bulk electrical conductivity
- Wind speed & direction
Weather stations must be properly sited, installed, and maintained, in order to be effective and reliable. To correctly site the weather station, it must be in a location that:
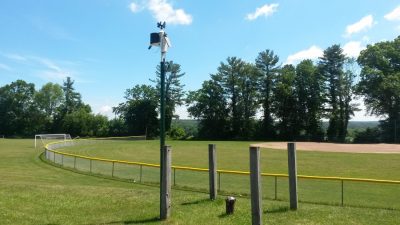
- Is in an open location, on level terrain, where no shading or disruption in wind flow can occur. It should be sited well away from large obstacles, such as fences, buildings, and trees (by a distance equal to 7-10 times the height of the obstacle), to account for seasonal changes in shade and wind patterns.
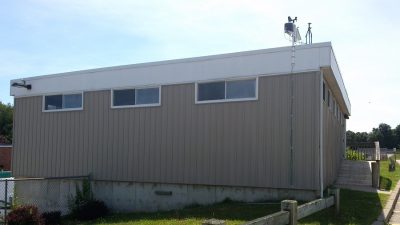
- Is directly on a turf area, in a location free from excessive radiant heat provided by adjacent driveways, sidewalks, and buildings, which will produce misleadingly higher air temperatures, lower humidity and higher ET values. Weather stations often complement in-ground irrigation systems.
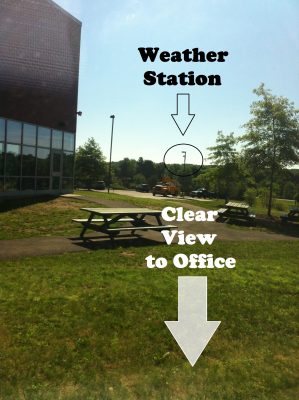
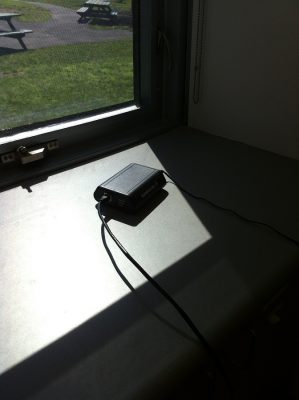
- Accounts for specific considerations in a school/public environment: Weather stations should be protected from vandalism. Security systems’ firewall settings must account for reading weather station data. For accurate readings, weather stations must also be placed in a location with a clear site line to the office where data will be monitored (see photo, top of next page).
WHY IS MONITORING WEATHER IMPORTANT?
Weather conditions can vary over short distances, so off-site measurements from a public weather network may not accurately reflect the precipitation and temperature in the immediate vicinity of a school’s athletic fields and grounds. For irrigation scheduling and Integrated Pest Management (IPM), more specific measurements may be required.
- Irrigated athletic fields can require significant amounts of irrigation to remain dense and healthy, especially given the typically challenging conditions (e.g., compaction and heavy wear) usually associated with school athletic fields.
- Weather stations can estimate the evapotranspiration (ET) rate of a turfgrass area. Awareness of water loss through ET can be a valuable component for making irrigation management decisions.
- Scheduling irrigation events according to observed ET water loss rates, rather than irrigating on an automatic schedule, minimizes wasteful water loss and ineffective watering.
-
- Weather stations can be used with irrigation scheduling and as an integral tool used in a school’s IPM program.
- IPM is a sustainable and scientific approach to pest control that strives to address and correct the root causes of pest problems. IPM practitioners consider economic and environmental issues in their decision-making process, with an emphasis on ecosystem-based strategies that minimize risks to human health and the environment. IPM programs include scouting for plant pests, adjusting cultural practices, modifying fertilizer amounts, and minimizing the use of pesticide applications.
- Weather stations can support accurate IPM decisions. Pest management decisions based on growing degree days are more accurate than those made while following a monthly calendar-based approach to scheduled maintenance and decisions. Weather conditions that impact insect pest and disease development, weed germination, and seedhead emergence of broadleaf and grassy weeds vary from year to year. Where chemical control methods are not prohibited, predicting the optimal time for chemical treatment is dependent on accurate and detailed local microclimate information.
HOW TO CALCULATE GROWING DEGREE DAYS (GDD)
Many turf and grounds managers have long used calendar dates or phenological markers as a basis for pest management programs. For example, many apply a pre-emergent crabgrass herbicide every year during the first week of April, or approximately when forsythia begins to bloom.
Using Growing Degree Day (GDD) units, based on information collected from weather stations, is a more precise way to track plant or insect development and growth. GDDs, recorded daily over the course of the growing season, represent the accumulation of “heat units,” based on changes in temperature. For each day that the average temperature is one degree above the base temperature (the threshold above which the insect or plant’s growth begins), one degree-day accumulates. For agricultural crops, the most commonly used base temperature is 50o. GDDs are used with biological and other pest control measures to time corrective treatments in order to apply product at the point of greatest pest vulnerability. Using growing degree days may contradict or confirm accepted treatments based on calendar dates or phenological indicators.
Example: Growing Degree Days charted for the first week of April, 2018, in Storrs, CT.1
| Calendar Date | April 8 | April 9 | April 10 | April 11 | April 12 | April 13 | April 14 |
| Daily Average Temp ºF | 32.7 | 34.1 | 34.4 | 38.7 | 44.1 | 57.5 | 51.4 |
| Base Temperature ºF | 50 | 50 | 50 | 50 | 50 | 50 | 50 |
| Daily GDD | 0 | 0 | 0 | 0 | 0 | 7.5 | 1.4 |
| Cumulative GDD | 0 | 0 | 0 | 0 | 0 | 7.5 | 8.9 |
Example: Growing Degree Days charted for early July, 2018, in Storrs, CT.
| Calendar Date | June 28 | June 29 | June 30 | July 1 | July 2 | July 3 | July 4 |
| Daily Average Temp ºF | 69.7 | 75.9 | 78.6 | 81.3 | 79.1 | 77.7 | 79.8 |
| Base Temperature ºF | 50 | 50 | 50 | 50 | 50 | 50 | 50 |
| Daily GDD | 19.7 | 25.5 | 28.9 | 31.3 | 29.8 | 30.6 | 30.8 |
| Cumulative GDD since April 1 | 824.1 | 849.6 | 878.5 | 909.8 | 939.6 | 970.2 | 1001.0 |
How to Calculate Growing Degree Days (GDD):
- Record the daily maximum and minimum temperatures.
- Calculate the average daily temperature.
- Subtract the base temperature from this average (most commonly 50o).
- Calculated GDD’s are added to the previous day’s GDD, for a cumulative recorded total.
(Max Temp. + Min. Temp./2) - Base Temperature = Daily GDD
Example for a single day: High temperature = 70o; Low temperature = 40o
Base temperature = 50o
Growing Degree Days = (70o + 40o) / 2 = 55o (average temp) - 50o (base temp) = 5 GDD
- The maximum and minimum temperature must be recorded, and the daily GDD calculated and totaled, every day between March 1 and September 30 in order to determine the accumulated GDD.
- If the average temperature is below the base temperature, a zero (0) is entered for the day.
- Minimum and maximum temperatures should be recorded from a Min/Max thermometer about the same time each day, preferably in the mid-morning or late afternoon.
HOW CAN THE INFORMATION COLLECTED FROM WEATHER STATIONS BE USED IN TURF AND GROUNDS MANAGEMENT PROGRAMS?
- Pest Management of Weeds, Insects, and Diseases:
A. Improve decisions about timing of cultural management strategies and methods of potential control options.
B. Estimate the timing of weed emergence, disease onset, and insect growth stages, based on GDD calculations and soil temperature readings.
C. Substantiates the timing of pre- or post-emergent herbicide use, where permitted.
Weed Management:
-
-
- Many weed management decisions are based on the timing of seedling emergence, which can be especially challenging to predict, as weed seedlings typically emerge over an extended period of time. The timing of seedling emergence is influenced by many factors, including soil temperature, soil water availability, soil depth, and soil type. For example, crabgrass germinates over many weeks during the spring and early summer. Using 50º as the base temperature to calculate the GDD2:
-
| Crabgrass Emergence | GDD | Potential Control Strategies |
| 25% | 560 | |
| 50% | 800 | Combination of pre- and post-emergent products would work well at 800 GDD, to kill recently emerged crabgrass and prevent remaining seeds from germinating (especially if certain treatments are most effective on juvenile plants). |
| 75% | 1100 | Post-emergent herbicide at above 1000 GDD would be ineffective. |
| 100% | 1700 |
Insect Management:
Weather station data can predict the best time to scout for damaging insect pests, as GDD may follow emergence or the morphological development of the pest.
-
-
- Growth and activity of insects depends on the surrounding external temperatures. Their development is directly proportional to increasing heat as the season progresses. There is a range of temperature within which each insect grows: below that range, no development occurs; there is an optimum temperature range in which rapid growth occurs; and a maximum temperature, above which development stops. Insect development may be accelerated during warmer years and delayed during cooler years.
- School grounds managers can use information on the amount of accumulated heat, measured in GDD, to create predictions of when to expect and scout for these insect pests.
- Turf and grounds managers must routinely scout fields to monitor for the presence of damaging insect pests, such as scarab beetle grubs in turf or lacebugs in landscape plantings, in order to decide if intervention is needed. Where permitted, biocontrol agents or insecticides must be applied at the optimal time to ensure that treatment is as effective as possible. The timing of both scouting and application can change from year to year.
-
Disease Management:
-
-
- Fungi that cause turfgrass diseases are highly dependent on certain environmental conditions for growth and infection. Monitoring temperature and moisture through weather stations makes it possible to predict and prepare for potential disease development. Disease forecasting can optimize the timing of treatment applications (where permitted) and improve control.
-
2. Irrigation scheduling:
-
- Help determine when and where to irrigate, based on soil moisture and ET readings.
3. Where pesticides are not allowed and irrigation is not used, weather stations can still be a critically helpful tool for scouting (e.g., awareness of beetle emergence, which will be followed by reproduction and grub emergence) and timing of cultural practices (e.g., mowing to prevent weed seed development).
Glossary:
Dew Point Humidity: the temperature at which the air can no longer "hold" all of the water vapor that is mixed with it, and some of the water vapor must condense into liquid water. The dew point is always lower than (or equal to) the air temperature.
Evapotranspiration: Evapotranspiration is the loss of water occurring in plants from the processes of evaporation and transpiration. Evaporation occurs when water changes to vapor on either soil or plant surfaces. Transpiration refers to the water lost through the leaves of plants.
Microclimate: the climate of a very small or restricted area, especially when this differs from the climate of the surrounding area.
Phenology: the study of cyclic and seasonal natural phenomena, especially in relation to climate and plant and animal life.
Relative Humidity: the amount of water vapor present in air expressed as a percentage of the amount needed for saturation at the same temperature.
Soil bulk electrical conductivity: a measurement that correlates with soil properties that affect crop productivity, including soil texture, cation exchange capacity (CEC), drainage conditions, organic matter level, salinity, and subsoil characteristics.
Sources:
- Bayer, A., van Iersel, M. & Chappell, M. (2017). What is a Weather Station and Can it Benefit Ornamental Growers? UGA Cooperative Extension. secure.caes.uga.edu/extension/
publications/files/pdf/B% 201475_2.PDF - Bessin, R. & Villanueva, R. (Revised 2019). Predicting Insect Development Using Degree Days. University of Kentucky. entomology.ca.uky.edu/ef123
- Bishop, B. (2011). New Enviro-weather tools help predict presence of damaging insect pests. Michigan State University Extension. www.canr.msu.edu/news/new_
enviro_weather_tools_help_ predict_presence_of_damaging_ insect_pests - Brown, P. & Russell, B. (Revised 2010). Siting and Maintenance of Weather Stations. Arizona Cooperative Extension. extension.arizona.edu/sites/
extension.arizona.edu/files/ pubs/az1260.pdf - Cardina, J., Herms, C., & Herms, D. (2020). Phenology and Weed Management. Ohio State University.
- Clark, B. & Larson, Z. (Updated 2020). Understanding Growing Degree Days. PennState Extension. extension.psu.edu/
understanding-growing-degree- days - Cornell University Extension. (n.d.). Managing Pest Pressure. safesportsfields.
cals.cornell.edu/pests/ - Cornell University Extension. (Updated 2022 by D. Olmstead). Weather Station Maintenance Guide. newa.cornell.edu/
maintenance-guide/ - Ebdon, J. S. & DaCosta, M. (2010). Funding Proposal: Efficient Irrigation for Recreational Turf: Evapotranspiration and Crop Coefficients. University of Massachusetts. ag.umass.edu/sites/ag.umass.
edu/files/projects/related- files/2010_et_kc.pdf - Forcella, F. (n.d.). Estimating the Timing of Weed Emergence. North Central Soil Conservation Research Laboratory, USDA-ARS.
- Siegert, N. W., McCullough, D. G. & Andresen, J. A. (n.d.). Growing Degree Day Information. Michigan State University Extension. www.canr.msu.edu/ipm/
agriculture/christmas_trees/ growing_degree_day_ information#landscapeinfo - Simisky, T. (2017). Growing Degree Days for Management of Insect Pests in the Landscape. UMass Extension. ag.umass.edu/landscape/fact-
sheets/growing-degree-days- for-management-of-insect- pests-in-landscape - Skorulski, J. (2013). Getting a Handle on Nature’s Clock. United States Golf Association. gsrpdf.lib.msu.edu/ticpdf.py?
file=/article/skorulski- getting-8-23-13.pdf
Questions? Contact:
Vickie Wallace
UConn Extension
Extension Educator
Sustainable Turf and Landscape
Phone: (860) 885-2826
Email: victoria.wallace@uconn.edu
Web: ipm.uconn.edu/school
Funds to support the creation of this document were provided by the Connecticut Department of Energy and Environmental Protection. UConn Extension is committed to providing equal access and full participation for individuals with disabilities within all our programs and activities. Visit s.uconn.edu/accessibility for more resources. UConn is an equal opportunity program provider and employer.
©UConn Extension. All rights reserved.
Updated July 2018
![]()
![]()